Data visualizations
CanvasData wranglingHTML UI
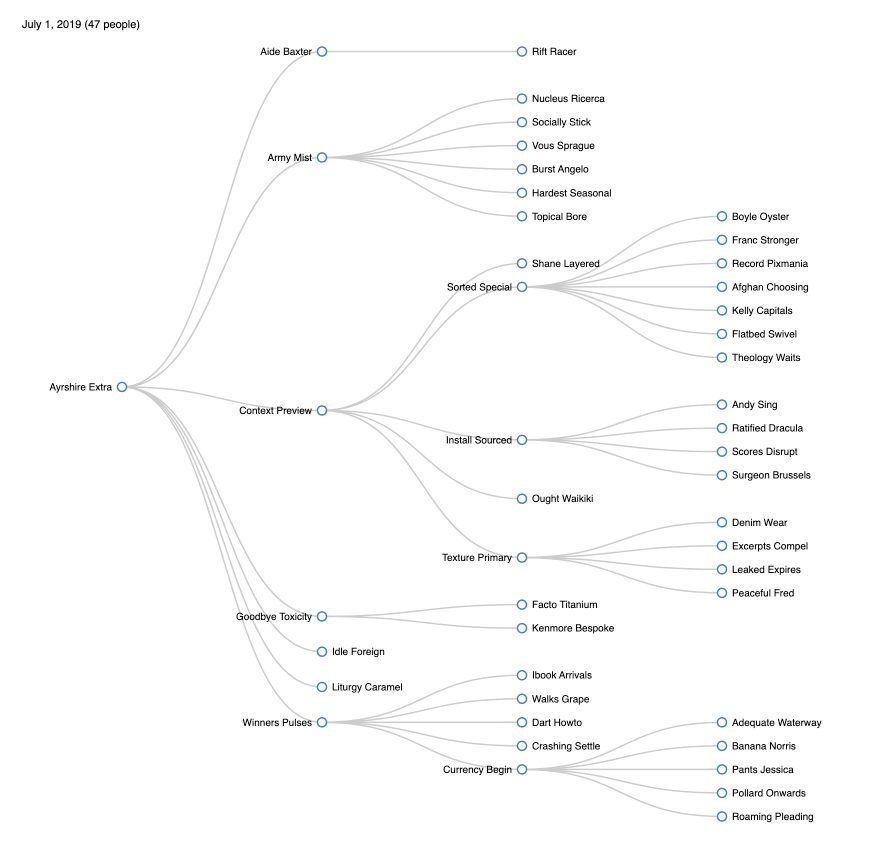
This is a quite open-ended project. Data visualization is the process of generating graphics that represent data in order to make it more understandable. A good visualization can give insights into data that might not be at all apparent from the raw data.
For this project you can either start with real data, perhaps from a class project for some other class or something you find on the web, and then try to visualize it. Or you can focus more on the graphics side, generating fake data and then coming up with interesting ways to display it.
An extremely advanced option for this project, which you should only tackle if you are quite comfortable already with manipulating the HTML DOM with Javascript, is to learn to use the d3.js library.